Proactive Meta Campaign Health Monitoring — Priority Queue for Faster Decisions
Stop checking Ads Manager. Start receiving a prioritized daily brief. Learn how Meta campaign health monitoring with a Campaign Priority Queue shifts teams from dashboard archaeology to fast intervention.

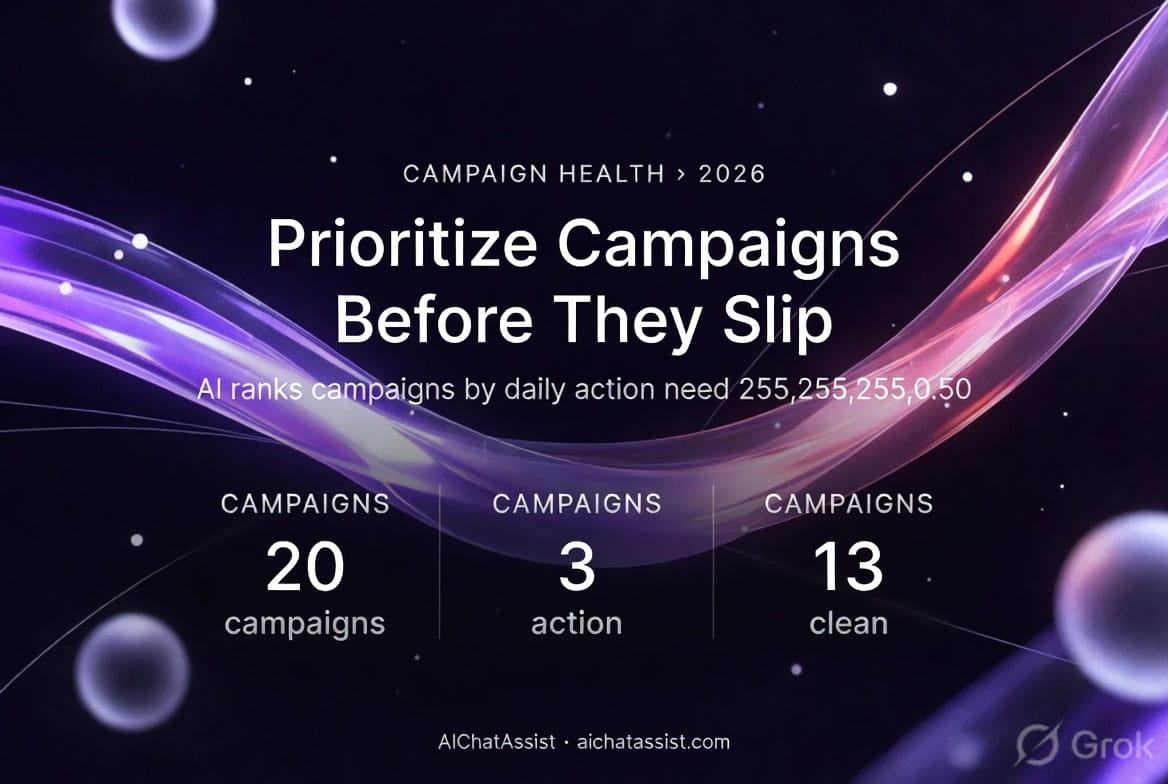
Every morning your media buyer opens Ads Manager and survives the same ritual: 20 campaigns. One hour. A backlog of alarms. A gamble on what to fix first. There is another way.
Key Insights
- Most teams don't have a visibility problem. They have aDecision Latencyproblem.
- Manual triage of 20 campaigns wastes the most valuable resource: time when a campaign can still be fixed.
- AI should not replace human intuition. It should hand it a priority queue: Red / Amber / Green — ready for action.
Hook: The Morning That Could Have Been Prevented
They woke up to the alert. The line item had been spending, but leads had stopped. By the time the report landed, the spend had already bled a week’s budget.
Sound familiar? Most teams notice the failure when their reporting finally says there is one. The failure itself happened days earlier, in a window when someone could have stopped the bleed with a single decision.
What’s Actually Happening
Here’s the problem: your media buyer spends an hour every morning manually triaging 20 campaigns. They look at metrics, open Ads Manager, chase anomalies, and hope they caught the worst ones first.
That ritual is not analysis. It’s reactive. It’s archaeology. We call itdashboard archaeology.
Common Advice — And Why Smart Teams Still Fail
Popular advice: check campaigns daily. Build dashboards. Add more metrics. Hire more junior buyers to do the triage.
Why smart teams follow that advice: because more eyes and more reports feel like control. Because recognizable processes are easy to measure. Because the mental model is: more data = fewer surprises.
Why it fails: reports explain yesterday. Dashboards justify decisions after the damage is done. More data multiplies the decisions you must make — and slows your ability to make the right one fast.
Direct Claim
Meta campaign health monitoring must be measured by how fast it tells you what to do, not how much it tells you.
That single shift — from visibility to intervention — is the only way to stop budget leakage before it compounds.
Stop Triaging. Start Acting.
Think about the morning described at the top: 20 campaigns, one hour of manual triage. Now imagine this instead: an AI hands your buyer a priority brief before they open Ads Manager—3 need action, 4 need watching, 13 are clean.
20 campaigns
What your buyer opens every morning.
Priority Queue: 3 Red / 4 Amber / 13 Green
What they should receive before clicking a single campaign.
This is not automation that replaces judgment. It is decision intelligence that shortens theDecision Latencyand widens theIntervention Window.
Why Manual Ads Manager Triage Always Loses
- Time is the vector of damage. A delayed decision compounds spend that produces no return.
- Manual inspection is sequential. You only get to one campaign at a time. Prioritization becomes guesswork.
- Humans are inconsistent. Mood, context, and competing tasks change who gets attention and when.
That's backwards. The goal isn't to inspect everything — it's to act on the small set that actually moves outcomes.
What Teams Mislabel as ‘Monitoring’
Most monitoring is passive: a dashboard shows trends, an alert fires when a threshold trips, a ticket is created. Teams pat themselves on the back and call it coverage.
The irony is that this coverage often increases the time to decide. More graphs lead to analysis paralysis. Alerts create noise. That's why we invented the termReactive Analytics Trap.
Core Claim: Decision Latency, Not Data Volume, Kills Performance
If you can’t act inside theIntervention Window, visibility means nothing. The only metric that matters for campaign protection is how fast you can move from signal to decision.
Meta campaign health monitoring that fails to shorten that path is just a prettier way to find yesterday's mistakes.
Priority Queue: The Output That Matters
Here’s the specific output your team needs. Not a dashboard. Not a PDF. A ranked, time-sensitive brief with clear actions.
- Red — Immediate intervention required. Stop, pause, reduce, or reallocate now.
- Amber — Watch closely. Reassess in a short, defined interval.
- Green — No action required. Monitor at standard cadence.
Call it aCampaign Priority Queue. Call it the difference between preventing and mourning revenue leakage.
Comparison: Manual Ads Manager Triage vs AI Priority Queue
| Dimension | Manual Ads Manager Triage | AI Priority Queue |
|---|---|---|
| Speed to decision | Minutes to hours per campaign; sequential | Seconds to identify top risks; ranked |
| Human attention | Scattered; noisy | Focused on 3–5 items that matter |
| False positives | High—alerts from thresholds; manual bias | Lower—scored with context and priority |
| Outcome | Reactive fixes after damage | Timely intervention before damage compounds |
The Anatomy of a Failure
Open: A chronological, step-by-step breakdown
- Monday: Signal appears — conversion rate drops in a campaign after a creative update.
- Tuesday: Automated thresholds in the dashboard have not yet tripped because raw spend and clicks still look stable.
- Wednesday: A junior buyer skims the account; the campaign isn't at the top of their list.
- Thursday: Reporting aggregates the drop and surfaces it, but the report arrives after four days of wasted spend.
- Friday: The team pauses the campaign. The budget is wasted. The client asks for explanations.
That sequence is common. The actual failure happened Monday. The report noticed it Friday. The damage is the time between.
The Unit Economics of Delay
Open: Algebraic breakdown of hidden cost
We won’t invent numbers. Instead, use variables to see the scale:
Let B = daily ad budget for a campaign.
Let D = days of delay between signal and intervention.
Let L = proportion of spend during D that produces no return (0 < L < 1).
Lost value = B × D × L.
Now consider N campaigns with similar unnoticed drifts in the same week. Loss multiplies.
The point: every day of delay scales linearly with direct wasted spend and non-linearly with operational cost — churned clients, missed growth windows, and team time spent explaining.
The Technical Bottleneck
Open: Where the pipeline actually breaks
- Data timeliness. Many systems pull aggregated metrics at slow cadence. By the time you see the anomaly, the campaign has moved on.
- Context collapse. Metrics lack context: creative changes, bid changes, funnel incidents. Without context, signals are noisy.
- Ranking gap. Systems surface anomalies but don't score them by urgency or business impact. So everything looks important.
- Human routing. Alerts land in queues or emails. That routing adds friction and increasesDecision Latency.
The fix requires building a narrow pipeline: rapid ingest, context enrichment, risk scoring, and prioritized output to the human decision-maker.
The Intervention Protocol — Exact Steps Teams Must Execute
Open: Tactical playbook
- Input: AI runs a 4-second triage across 20 campaigns. Output is a Priority Queue with Red/Amber/Green labels and a short rationale for each.
- Human decision: Media buyer reviews the Red items first within a 15-minute window and takes one of four actions: pause, reduce spend, switch creative, or reassign budget.
- Follow-up: Amber items are scheduled for reassessment in a short interval (e.g., 4–12 hours) with conditional rules attached.
- Green items are checked at standard cadence but do not consume immediate attention.
- Post-action: Each intervention logs the decision, outcome, and a micro-insight usable by the AI to refine future prioritization.
This protocol shortens the path from signal to intervention and makes every minute count.
Frame AI as Multiplier, Not Replacement
Here's the problem: some teams hand the keys to automation and expect miracles.
We believe this: relying solely on AI for campaign optimization is a recipe for disaster; human intuition is non-negotiable. AI sifts faster than any human, but it doesn't understand market nuance the way an experienced buyer does.
So the right architecture looks like this: AI quickly filters and prioritizes. Humans apply judgment, context, and creativity. The system then learns from human decisions.
Designing Your Meta Campaign Health Monitoring System
Build four layers, each with clear responsibilities:
- Data Ingest: Fast, near-real-time metrics pulled from the ad platform and enriched with campaign metadata.
- Context Engine: Ingest recent changes (creative swaps, targeting edits, landing page updates) so anomalies get framed.
- Risk Scorer: Scores issues by expected business impact and urgency, producing the Priority Queue.
- Human Interface: A minimal brief delivered to the buyer: one-line rationale, recommended action, and risk score.
That's aCampaign Intelligence Layer. It sits above data and beneath decisions.
Operationalizing Peace of Mind
Peace of mind comes from predictable workflows, not dashboards. If your team can start each day with a brief that says, "Fix these three things now," they can breathe.
That’s the promise of good meta campaign health monitoring: the cost of waking up to surprises goes down. The cost of missed opportunities goes down. The cost of hand-wringing goes down.
How Much Time Does This Save?
We won’t claim precise savings. The logical effect is obvious: replace 60 minutes of sequential inspection with a 4-second triage plus 15 minutes of targeted action. Your buyer does far less busy work and far more high-leverage decision-making.
The real benefit is a qualitative one: fewer emergency meetings, fewer client escalations, and fewer days of wasted budget.
What a Daily Brief Should Look Like
Deliver the brief in a single screen or message. Each item has:
- Priority label (Red/Amber/Green)
- One-sentence rationale (what changed and why it matters)
- Recommended action (pause, reduce, creative swap, reassign)
- Time-to-action recommendation (now, within 4 hours, monitor)
Nothing else. No graphs, no long PDFs. Immediate clarity.
Proof of Concept: A Minimal Acceptance Test
Don’t rebuild your entire stack. Run this POC:
- Pick the 20 campaigns your buyer currently inspects every morning.
- Build a fast ingest that pulls last 24 hours of metrics and recent change events.
- Create a simple risk score that highlights the top 3 campaigns by expected impact.
- Deliver the brief to your buyer for 10 business days and log actions and outcomes.
If your buyer prefers the brief, you’ve moved past visibility theatre.
Common Objections — Answered
- "AI will make mistakes and we'll miss context." Yes. That’s why the output is a brief for humans, not a set-and-forget automation.
- "We can't trust a black-box score." Then require one-line rationales from the model and mandate human confirmation for Red actions.
- "We don't have resources to build this." Start with a narrow POC for 20 campaigns and iterate.
Signals That Should Move a Campaign to Red
Red labels don't come from single metrics. They come from signals combined with context. Examples of contextual triggers:
- Sudden drop in lead volume after a creative swap, with stable spend.
- Conversion rate decline simultaneous with a landing page error event.
- Spend spike with falling quality (e.g., cost per qualified lead increases while quantity drops).
Those are the things a buyer must see first. Meta campaign health monitoring should surface them as Red.
Metrics That Doom Decision Speed
- Overly frequent, non-contextual alerts.
- Dashboards with dozens of panels that require interpretation.
- Reports delivered on slow cadence and with post-hoc analysis.
These create noise and slow human decisions. That’s the real tax paid by teams that prioritize more metrics over faster decisions.
Implementation Checklist
- Identify the 20 campaigns currently triaged each morning.
- Define the business-context events you care about (creative changes, landing updates).
- Build or configure a fast data pull for the last 24 hours.
- Create a simple risk-scoring function that ranks campaigns by expected impact.
- Deliver the Priority Queue to the buyer as a one-screen brief.
- Require human confirmation for Red actions and log outcomes.
Strategic Insight
If you want to protect budgets, stop treating monitoring as a compliance exercise. Treat it as a decision acceleration problem. Shorten the path from signal to human action.
This is how you prevent revenue leakage before it compounds.
What Success Looks Like
Success is not fewer dashboards. It's fewer emergency fixes. It's fewer days where you wake up and find wasted budget. It's a buyer who starts the day with a clear, ranked brief and finishes the day confident that nothing critical was missed.
Closing Provocation
If your morning routine still starts with Ads Manager, you are already losing. Change the routine. Let the brief come to you.
Book a demo to see a Campaign Health Priority Queue in action and decide whether you want to keep digging through yesterday's reports — or start preventing tomorrow’s losses.
FAQ
How does Meta campaign health monitoring differ from my dashboard?
Direct answer: It prioritizes decisions rather than displaying data. Practical explanation: Instead of surfacing raw charts, it produces a ranked brief (Red/Amber/Green) that tells your buyer which campaigns demand immediate action and why, reducing time-to-decision.
Will AI replace media buyers if we adopt automated campaign triage?
Direct answer: No. The system is a multiplier, not a replacement. Practical explanation: AI filters and ranks issues quickly; human buyers apply judgment, market nuance, and creative fixes. Red items require confirmation from a human before major changes.
What does a Campaign Priority Queue look like in practice?
Direct answer: A one-screen brief with ranked campaigns and recommended actions. Practical explanation: Each item includes priority label (Red/Amber/Green), a one-line rationale, a recommended action, and a time-to-action window so your buyer knows exactly what to do first.
How do we start a proof-of-concept without heavy engineering?
Direct answer: Narrow the scope to the 20 campaigns you already triage. Practical explanation: Build a fast 24-hour metric pull, enrich with recent change events, apply a simple risk score, and deliver the brief. Iterate from there.
What signals should move a campaign into Red?
Direct answer: Contextual, high-impact anomalies. Practical explanation: Examples include a drop in conversions after a creative swap, a landing page error coinciding with a conversion drop, or a spend spike with falling lead quality. These are surfaced as Red because they require immediate human action.
How does this approach protect daily ad spend?
Direct answer: By shortening decision time and focusing attention on the highest-risk items. Practical explanation: Rather than inspecting everything slowly, the Priority Queue flags the small set of campaigns that create the largest near-term risk to budget, enabling quick interventions and less wasted spend.